Monitor linux server using Prometheus and Grafana
Overview
We are going to cover the process on how to monitor linux server using prometheus and grafana using Docker. The entire setup will be installed and configured on Debian 10 Buster and Docker but this also can be done and will work on Ubuntu server or any other Linux distro running Docker. With this setup we’ll be able to perform Linux server monitoring and to track resource usage on our server(host machine) - CPU usage, RAM usage, SWAP, network, disk space and etc.
Small heads up - We would like to mention another monitoring solution in order to give you options which suits your needs, which has enterprise grade features and still is open-source(if you require it) and that is Zabbix. We covered the install process and setup on this post.
Prerequisites
This setup requires to have Docker installed and running on your machine. You can check out this link to install Docker on Debian or check out the official Docker documentation.
Another way install Docker is by using the official Docker auto-install script which is hosted on Docker.
curl -fsSL https://get.docker.com -o get-docker.sh
sudo sh get-docker.sh
Linux server monitoring setup(Deploying Prometheus, Grafana, Docker )
Install Node Exporter
1. After you have Docker installed and running, the first step of the setup is to install the Node Exporter tool. Node Exporter is the part Prometheus monitor and it’s purpose is to gather all the data from your machine so that Prometheus can retrieve it. Node Exporter also comes in a Docker container, so the setup will be straightforward.
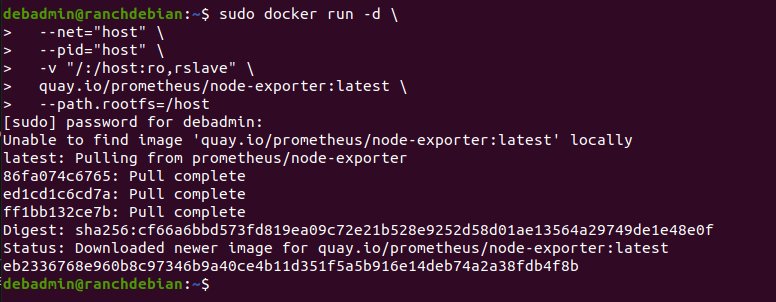
docker run -d --net="host" --pid="host" -v "/:/host:ro,rslave" quay.io/prometheus/node-exporter:latest --path.rootfs=/host
You can easily check if the Node Exporter is running properly. In the browser, open the node exporter URL - http://your-server-ip-adress:9100 and if you see a directory metrics with data populating in it, then it means it’s working.

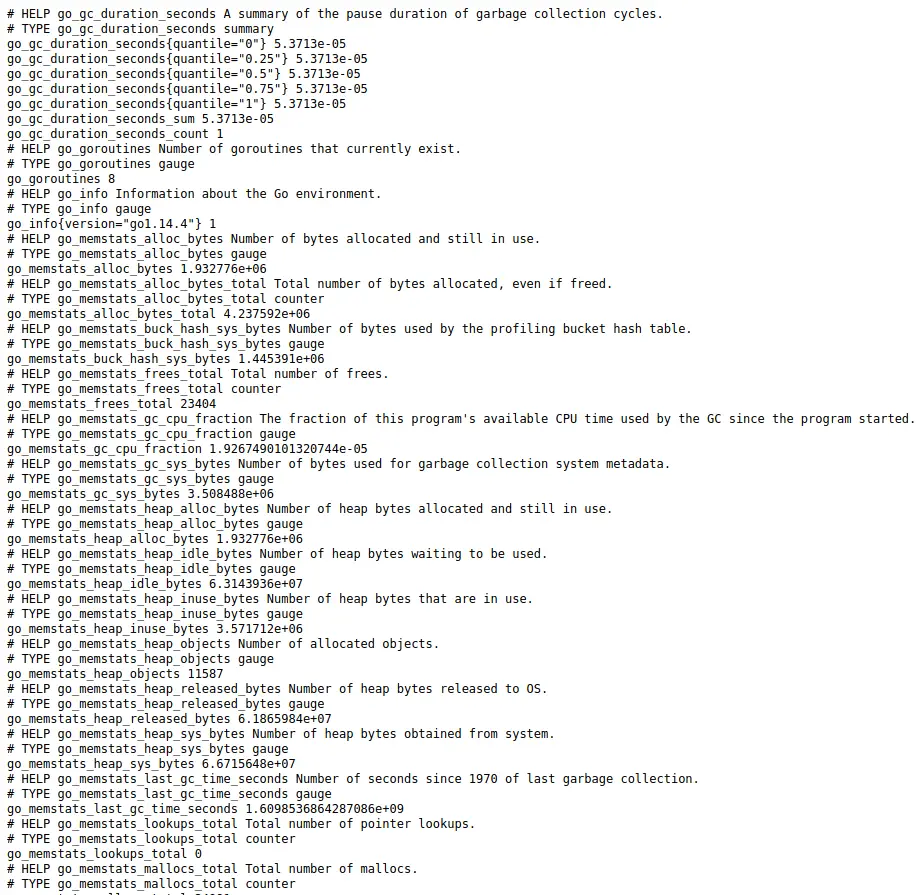
Other way to test it is with the command:
curl localhost:9100/metrics
or
curl http://your-server-ip-address:9100/metrics
Create a Prometheus YAML config
2. Now we need to make a Promethes YAML config file. Create this file where you want to place it on the server, but for the sake of the post, let’s have it placed in home directory.

You can do this step like this:
sudo touch ~/prometheus/prometheus.yml

sudo nano ~/prometheus/prometheus.yml
or just right away
sudo nano ~/prometheus/prometheus.yml
and then paste in the config and save the file and exit.
global:
scrape_interval: 5s
external_labels:
monitor: 'node'
scrape_configs:
- job_name: 'prometheus'
static_configs:
- targets: ['192.168.100.252:9090']
- job_name: 'node-exporter'
static_configs:
- targets: ['192.168.100.252:9100']
At the targets variable, write down the IP address of your server.
Deploy Prometheus Docker container
3. Next step is to install Prometheus, also with Docker. Run the next command and please do watch out on the path to the prometheus.yml file:
docker run -d --name prometheus -p 9090:9090 -v ~/prometheus/prometheus.yml:/etc/prometheus/prometheus.yml prom/prometheus

We are going to break down the command to explain it in more details:
- docker run -d –name prometheus -p 9090:9090 - this part of the command should be understandable to many - run a Docker image, name it prometheus and expose container port 9090 to the same port on the host server.
- -v ~/prometheus/prometheus/yml:/etc/prometheus/prometheus/yml - this is the most important part of the command when installing prometheus. On this part of the command, we’re telling Prometheus to use the prometheus.yml file we created in the previous step and where it’s located on the host server(home directory in this example) in order to configure itself with the parameters we have set and to place the same config file in the /etc directory of the Prometheus Docker container.
- prom/prometheus - this is a variable for Docker which Docker image from the Docker to download and install.
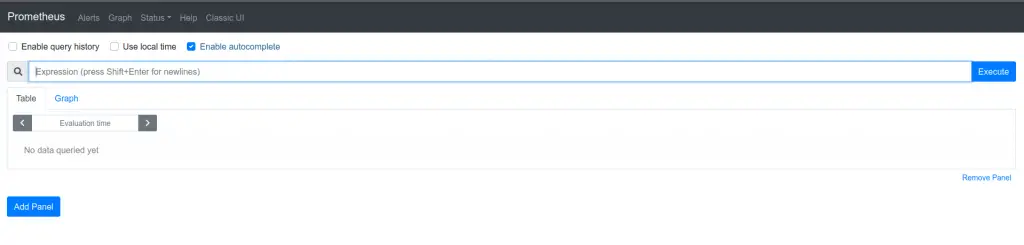
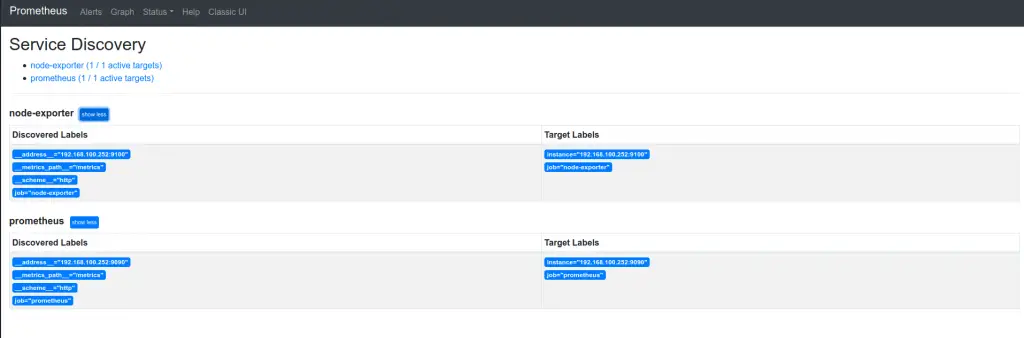
You can also check if Prometheus is running via web browser by opening also your server’s IP address with port 9090. You should get a result like in the pictures bellow:
Deploy Grafana Docker container
4. Now we can install Grafana. Also we will Grafana with Docker container.
docker run -d --name=grafana -p 3456:3000 grafana/grafana
Access the Grafana in your web browser. It will prompt you to login right away. The default user name and password is admin. It’s a temporary login. As soon as you login, the Grafana will ask from you to change the password right away.

Create a data source and a dashboard
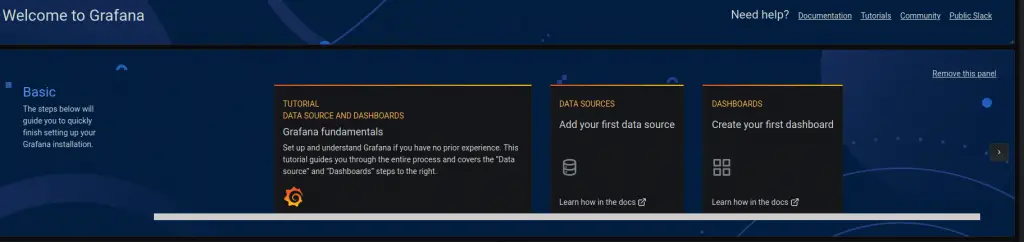
After the login, we need to create to create a new data source which Grafana will used for our Linux server monitor dashboard. So, first we’ll create the data source. Right on the Grafana home page, click on the - add your first data source option.
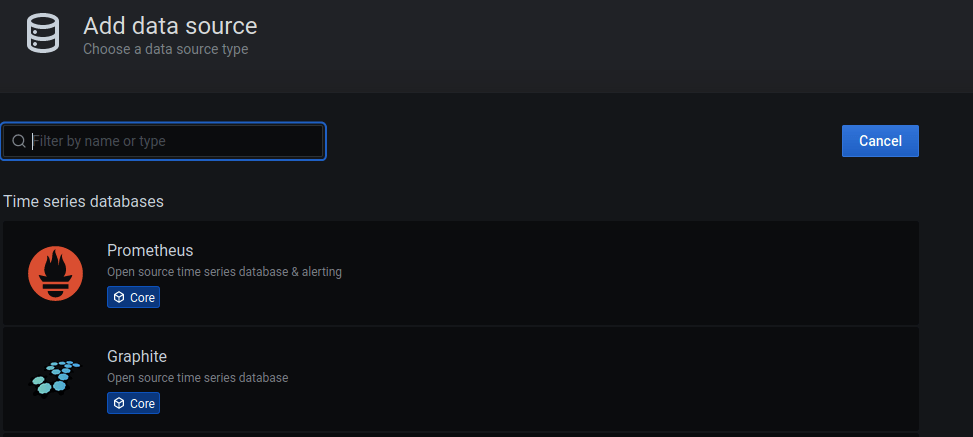
Choose for the data source option to be Prometheus - It’ll be the first available option right away.
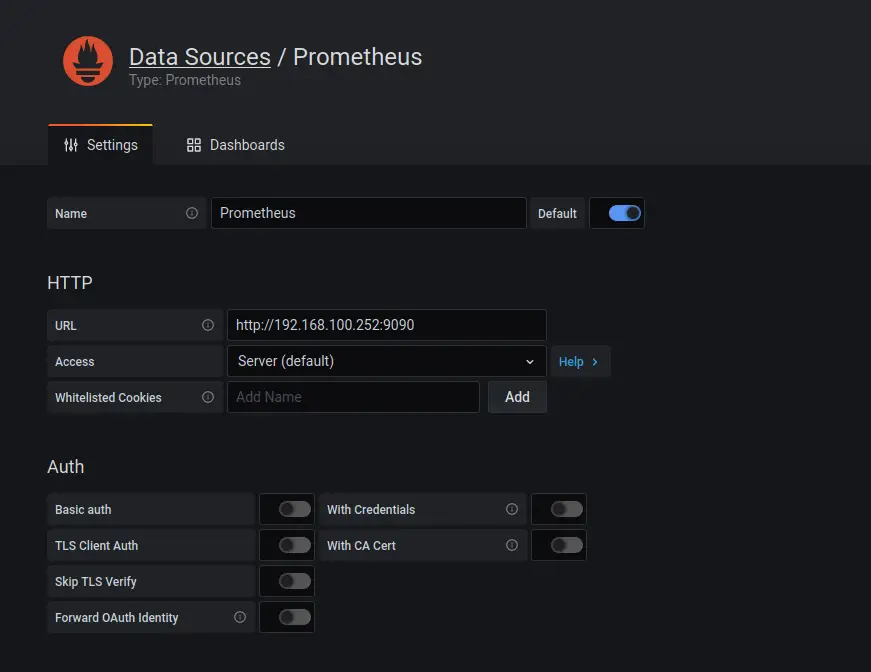
Name the data source as you want. On the URL input field, type in your server’s IP address with Prometheus port 9090 and HTTP. Like in the picture bellow.
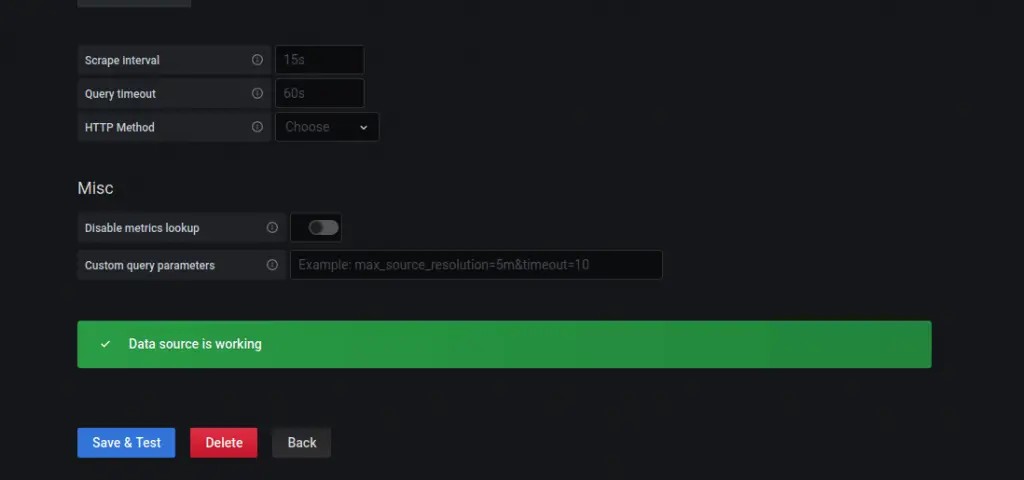
Save & test the data source, if all is good, it will pop out a prompt stating that the Data source is working.
Now to setup our Linux server monitor dashboard. You can create a new dashboard from scratch the way you want it(takes time), but also you can check out the Grafana site and see the already created dashboards by the Grafana community. In this example, we will do just that, import an existing dashboard. There are plenty Grafana dashboards for server monitoring which uses Prometheus and Node Exporter. The one we’re going to use for this example is this one.
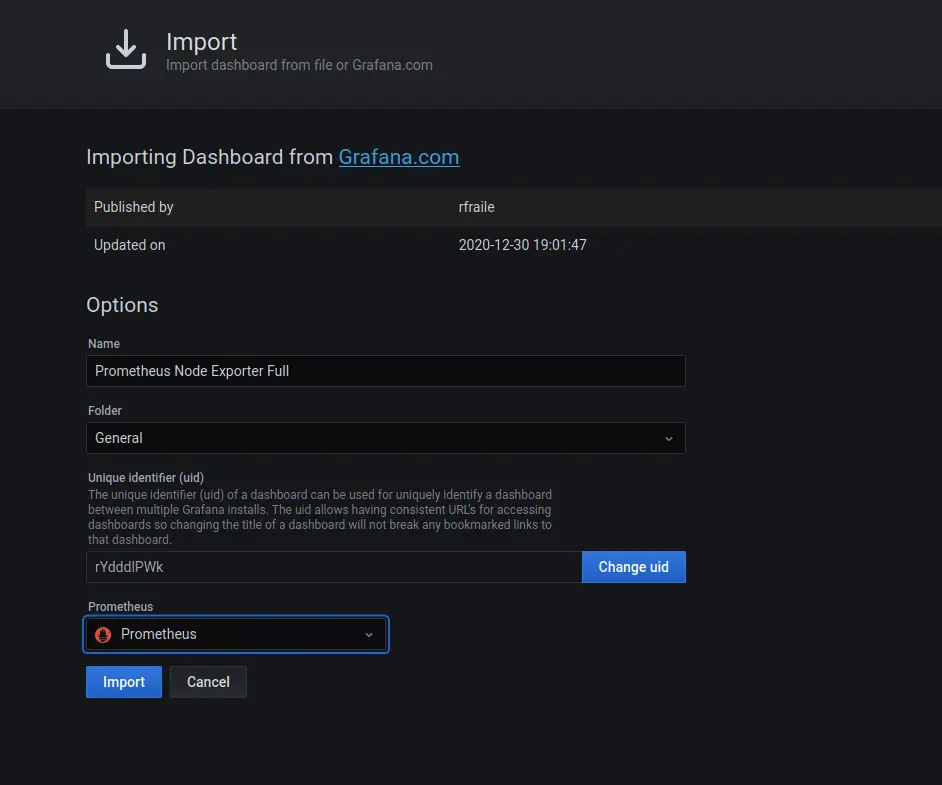
So, once you go on the import dashboard option, we just need to type in the Dashboard ID from the Grafana site - in this example it’s 1860. Name the dashboard and also the important part - to select the Prometheus as a data source for this dashboard. Then just click on the import button and that’s it, the end result the dashboard showcased bellow.
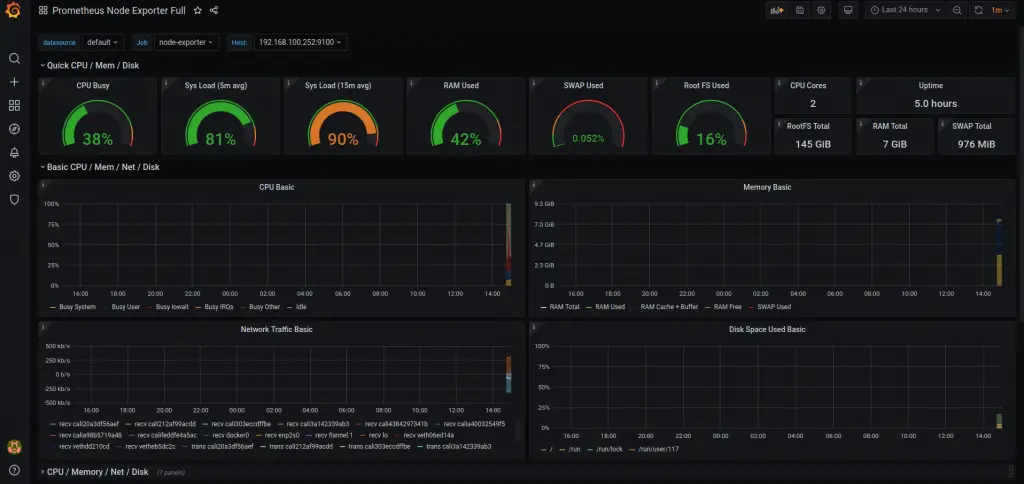
At the end of the setup, we should be able to monitor linux server using prometheus and grafana all running in Docker.
Summary
To summarize the article - we covered the steps on how to monitor linux server using Prometheus and Grafana and Docker. We showcased the steps of deploying the node exporter endpoint, deploying Prometheus and make it index the logs from the node exporter and finally deploying Grafana, adding the Prometheus data source and displaying the data on the Grafana dashboard.
This can be a really powerful monitor setup, since you can monitor Docker containers, have linux server monitoring for multiple hosts and also setup email notifications from Prometheus.
Thank you very much for your time and hope you found the post useful…